Scan Preparation
When a new sample has been mounted and the first scan collected, NXRefine provides a set of tools to prepare the data for transformation into S(Q). These are normally run using NeXpy dialogs accessible from the Refine Menu described below, which are used to select parameters for use in the data reduction, perform an analysis of all the collected frames in order to enable, for example, absorption corrections for each frame and other diagnostic information, launch a peak search function to identify all the Bragg peaks embedded in the data, define the sample space group, determine and optimize the sample orientation based on the Bragg peak assignments, and generate the Q-mesh used when transforming the data to reciprocal space. Typically, these steps are performed after the first sample rotation scan, often at room temperature or while the sample is cooling.
The results of this process are stored in a parent scans file,
named <sample>_scans.nxs, which is normally created alongside the
first scan (see New Scan). Every other scan of the sample copies
its initial orientation and reduction parameters from this parent before
the automated workflow reduces it, and is itself recorded in the
parent’s scan registry, so that the remaining scans can be reduced
automatically. See Parent Files and the Scan Registry for the full data model relating
a parent file to the scans it groups together.
The only requirement is that all the scans use the same experimental configuration as the parent and that the same sample space group can be used to orient all the scans. The unit cell parameters and orientation matrix are refined by a least-squares optimization of the Bragg peak locations identified in each new scan. If there is a significant change in the space group at a structural phase transition, it may be necessary to define different scan files as the parent for scans performed above or below the transition, respectively; alternatively, a subentry of an existing parent can be used to revise its settings for the second phase without disturbing the original results (see Initialize Scans).
In this section, we will describe the structure of the NeXus files as well as details of how the NeXpy GUI dialogs in the Refine Menu can be used to prepare the files for subsequent analysis.
NeXus files
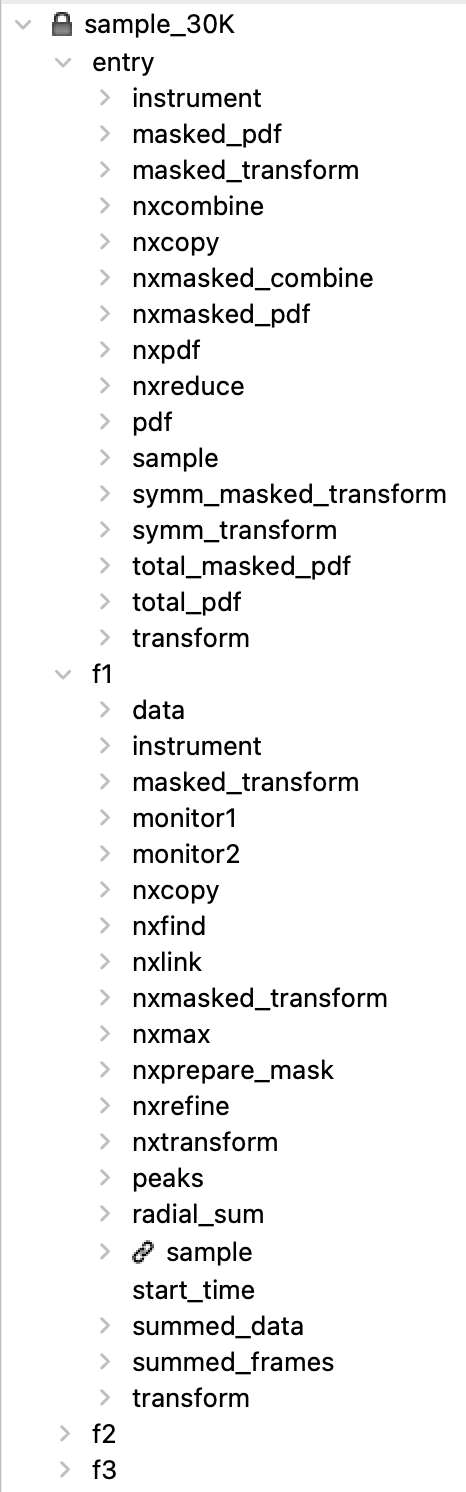
The scan files are stored using the hierarchical NeXus format, in which the data for each scan are stored in groups, or entries, conforming to the NXentry base class. There is one entry for each sample rotation scan, usually labelled f1, f2, f3, etc., although the number of such scans can vary. There is also a top-level entry (called ‘entry’), which contains the metadata that is common to all the rotation scans, as well as the results of merging the reduced data from each one.
The top-level entry of a parent scans file also contains an
nxscans group: the scan registry and shared-settings store described
in Parent Files and the Scan Registry. Each individual scan file instead carries a
single nxscans/parent field naming the parent it belongs to.
In the example on the right, most of the items are also groups corresponding to different base classes, that contain either raw data, reduced data, metadata, or information resulting from each component of the workflow. When the NeXus file is loaded into NeXpy, its contents can be inspected in a tree view, such as the one shown here. Here are a few examples.
- instrument
This is a group that contains instrumental parameters, such as the incident wavelength, detector distance, goniometer angles, and attenuators. It also stores the powder calibration data and parameters.
- sample
This group contains the sample information, including the chemical formula, unit cell parameters, space and Laue groups, and sample environment parameters, such as temperature. NXRefine assumes that the sample parameters are independent of the particular rotation scan, so all the sample groups are linked to the one stored in the ‘entry’ group.
If the beam supports the import of monitor data from metadata files, there will be a group, called monitor in the entries for each rotation scan. This contains the beamline monitor values for each frame, which can be used to normalize to changes in the incident flux during the rotation.
Note
The import of monitor data is governed by the NXBeamLine class, or its sub-class customized for a specific beamline.
There are a number of groups in the entries for each rotation scan that contain the results of some of the analysis.
- peaks
This group contains the results of all the Bragg peaks identified by the peak search, such as their pixel coordinates on the detector, their polar and azimuthal angles, and intensities. These are used to determine the sample orientation matrix, using the ‘Refine Lattice’ dialog.
- frame_sum
This group contains groups that contain different sums over the raw data frames. (a) radial_sum contains an azimuthal average, using the powder calibration to define the beam center, as a function of polar angle. This should be approximately equivalent to a powder average of the single crystal data. (b) summed_data contains a 2D sum of all the frames with the pixel numbers as axes. (c) summed_frames contains a one-dimensional array produced by summing each frame.
Refine Menu
The NXRefine plugin to NeXpy installs a top-level menu labelled “Refine”, which allows parameters required for the data reduction workflow to be initialized.
Initialize Scans
This dialog is the starting point for preparing a scan files for data
reduction. After choosing a parent file, e.g., <sample>_scans.nxs
or a single scan file, e.g., <sample>_100K.nxs an “Entry”
pull-down selects which entry the actions below operate on, defaulting
to the top-level entry.
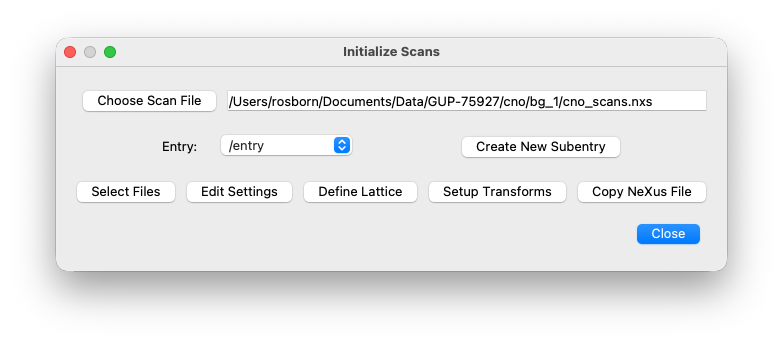
The pull-down can also select a subentry: a self-contained copy of
the workflow settings and results, stored at /entry/{name} in the
parent file and backed by a same-named sub-directory on disk for any
external files, such as masks or transform grids, that it needs.
Clicking “Create New Subentry” prompts for a name and a short
description and creates one. Selecting a subentry from the pull-down
re-targets every action below at it instead of the main entry, making it
possible to revise the reduction settings, lattice, or transform grid
for a sample and re-run the workflow without overwriting the original
results — see Parent Files and the Scan Registry for how subentries are represented on
disk.
The dialog then offers the following actions, each opening its own sub-dialog.
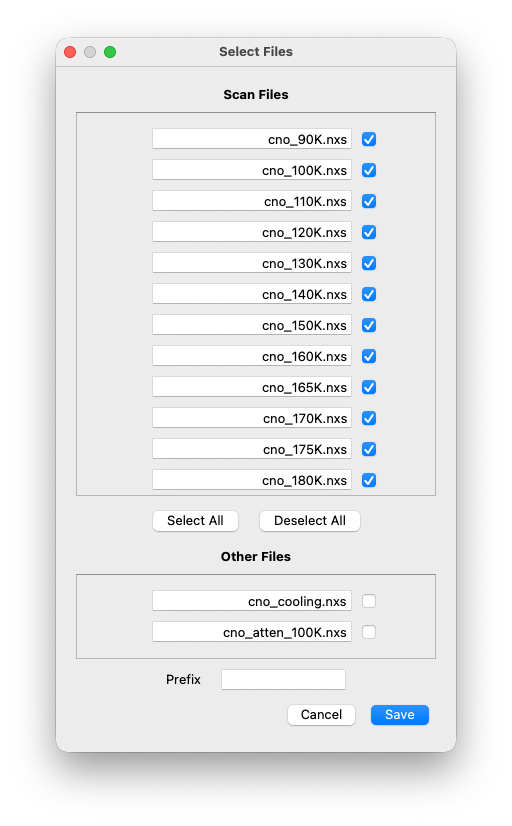
- Select Files
Registers or de-registers which scan files belong to the parent, and re-syncs the registry with scan files that already record this parent as theirs but were copied in separately. See “Reconciling a copied parent” in Parent Files and the Scan Registry for how this reconciliation works.
Note
If a single scan file was selected, this dialog will not be available.
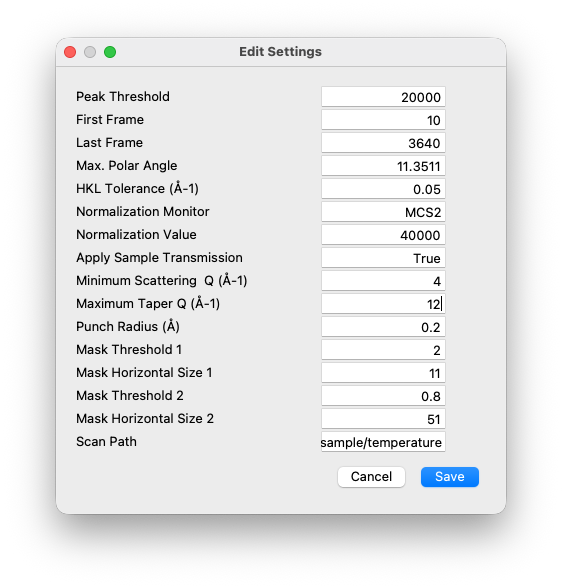
- Edit Settings
Sets the reduction parameters shared by every scan of the sample — Peak Threshold, First/Last Frame, Max. Polar Angle, HKL Tolerance, Normalization Monitor and Value, Punch Radius, and the Scan Path/Units used to label each scan — stored in the parent’s
nxscans/settingsgroup.
- Define Lattice
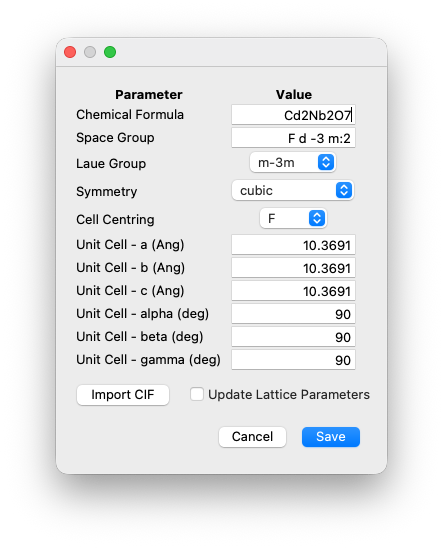
Sets the chemical formula, space group, Laue group, symmetry, cell centring, and unit cell parameters used to index the Bragg peaks, with an option to import them from a CIF file.
- Setup Transforms
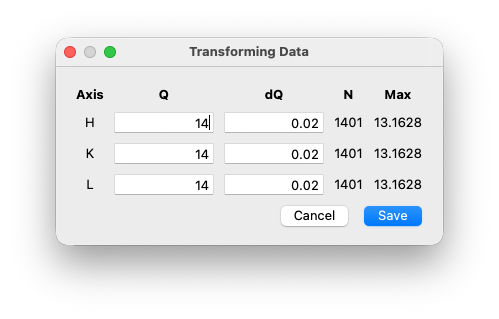
Defines the Q-mesh used when transforming the data to reciprocal space, by specifying the range, step size, and number of points along each of the H, K, and L axes.
- Copy NeXus File
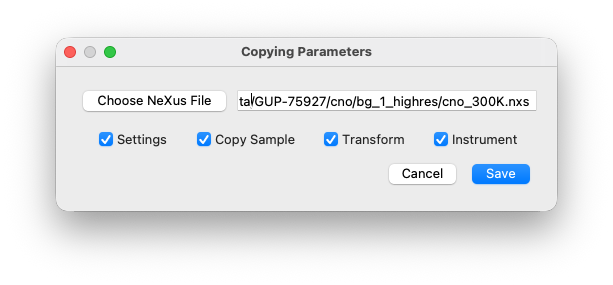
Copies settings, sample information, the transform grid, and/or instrument metadata from another NeXus file into the parent — useful copying settings from a single scan to a parent file.
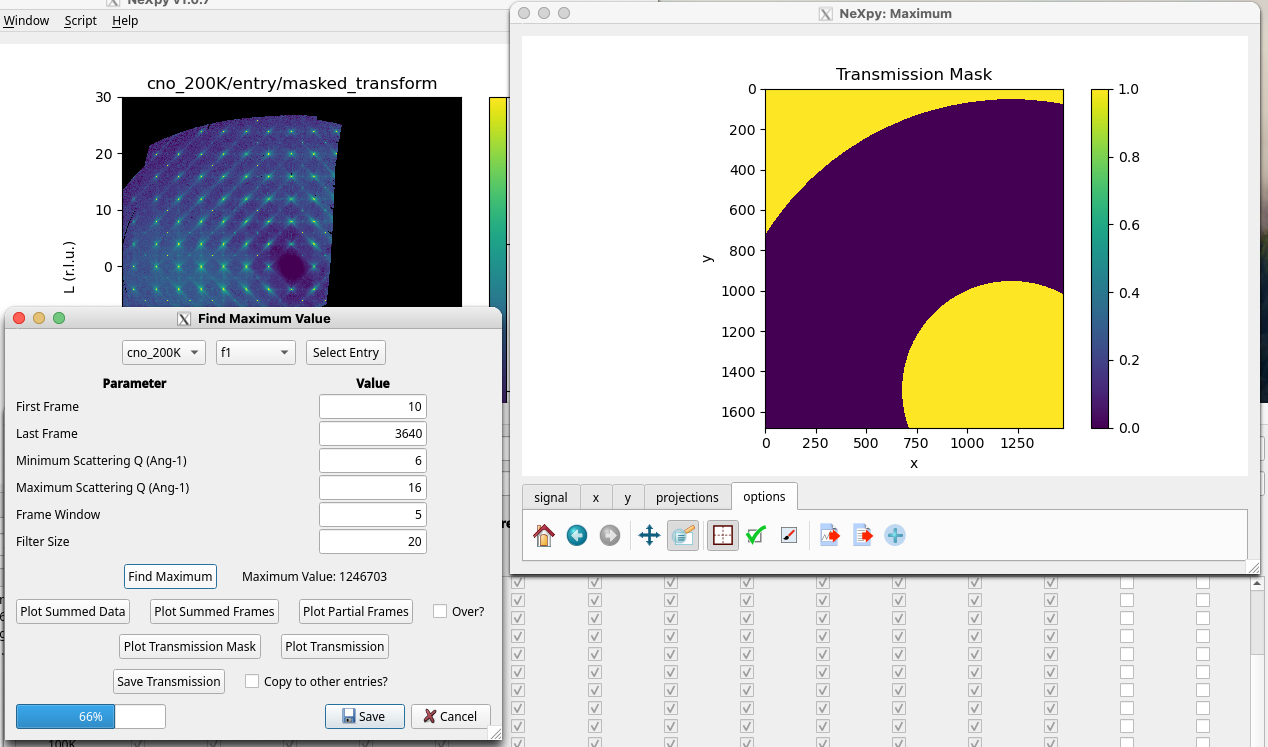
Find Maximum
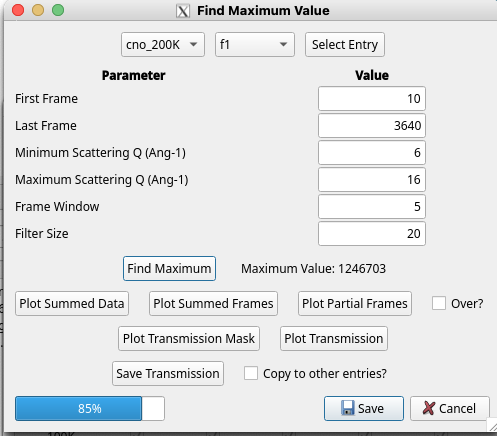
This dialog performs a scan of all the collected frames in order to generate different views of the raw data for diagnostic purposes, including the transmission as a function of frame, used for absorption corrections. The dialog allows a number of frames at the beginning and end of the rotation scan, as well as a scattering Q range, to be excluded.
Find Peaks
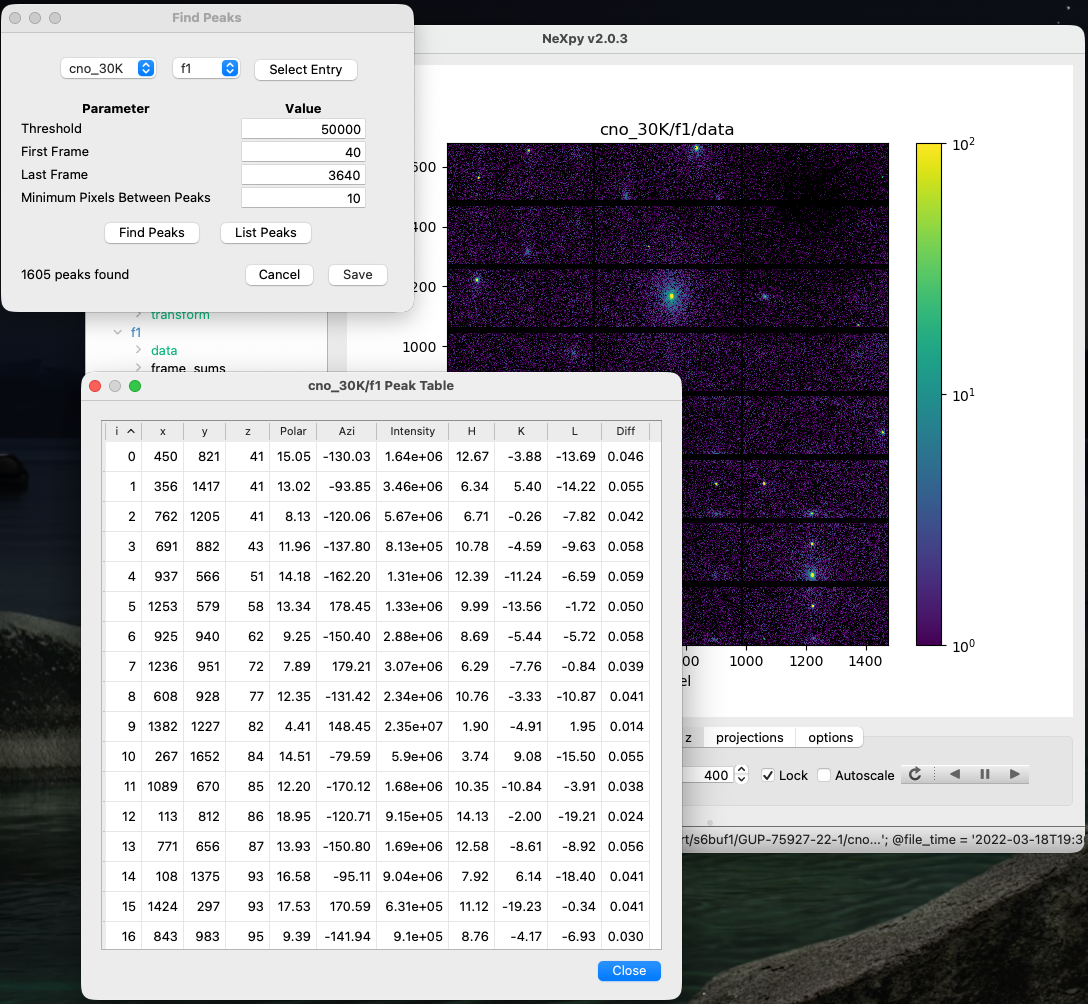
This dialog launches the peak search used to identify the Bragg peaks
embedded in the collected frames. Connected regions of intensity above
the Peak Threshold set in Initialize Scans, within the First and
Last Frame range, are located using a first-moment analysis, with peaks
that span successive frames merged into one and a minimum-pixel-
separation setting used to avoid double-counting nearby peaks. “Find
Peaks” runs the search and stores the results in the peaks group
described above; “List Peaks” displays them.
Refine Lattice
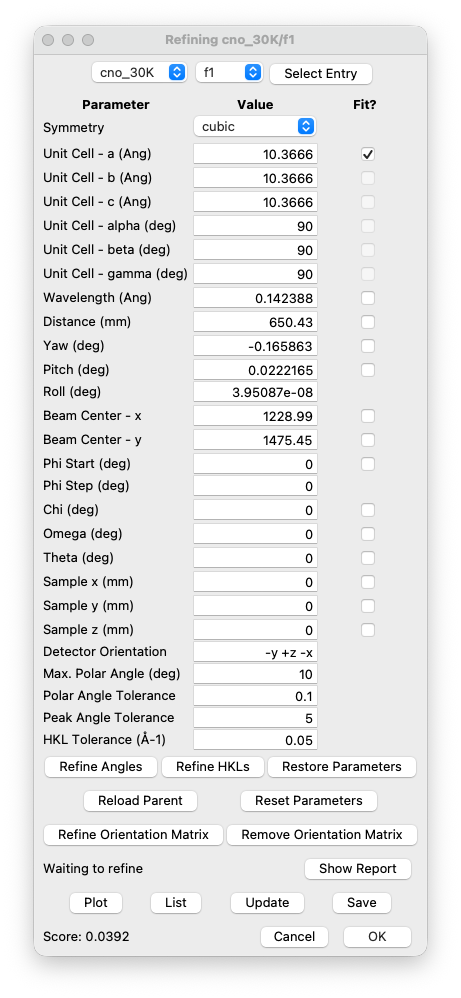
This dialog refines the unit cell parameters and orientation matrix by a
least-squares optimization against the Bragg peak positions stored in
the peaks group, starting from the space group and lattice defined
in Initialize Scans.
Prepare 3D Mask
This dialog builds a three-dimensional punch mask around the identified Bragg peaks, so that they can be excluded from further analysis of the diffuse scattering. Two threshold/horizontal-size pairs control how much of the surrounding volume is masked around each peak; “Prepare Mask” builds the mask and “Plot Mask” displays it.
