Sample Refinement
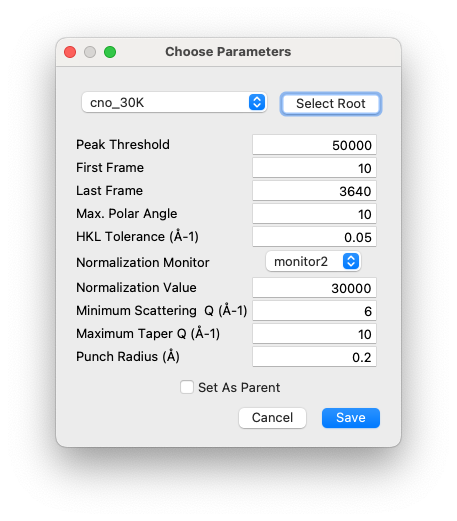
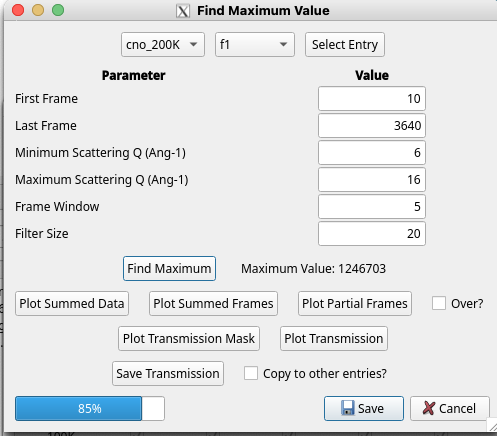
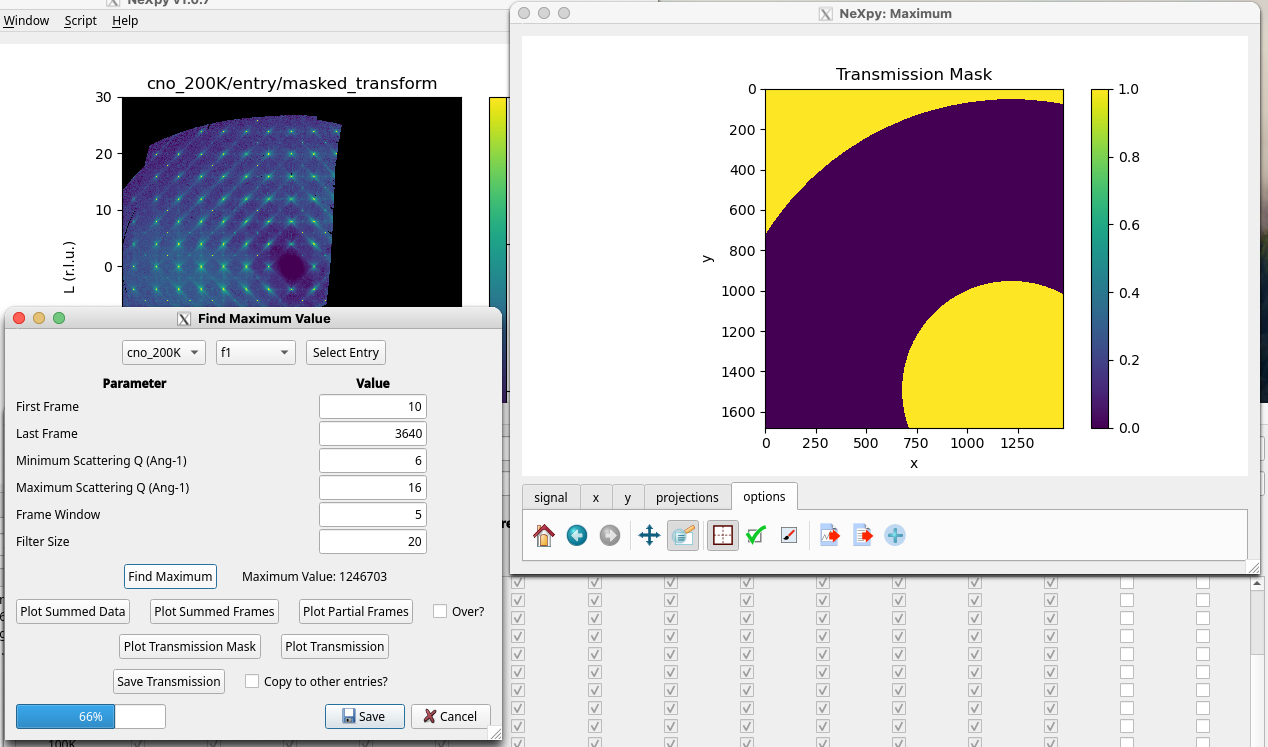
When a new sample has been mounted and the first scan collected, NXRefine provides a set of tools to prepare the data for transformation into S(Q). These are normally run using NeXpy dialogs accessible from the Refine Menu described below, which are used to select parameters for use in the data reduction, perform an analysis of all the collected frames in order to enable, for example, absorption corrections for each frame and other diagnostic information, launch a peak search function to identify all the Bragg peaks embedded in the data, define the sample space group, determine and optimize the sample orientation based on the Bragg peak assignments, and generate the Q-mesh used when transforming the data to reciprocal space. Typically, these steps are performed after the first sample rotation scan, often at room temperature or while the sample is cooling. The results of this process are stored in the associated NeXus scan file, which then is designated the “parent” file, from which all the other scans copy their initial orientation before the automated refinement. This allows the data from the remaining scans to be reduced by the automated workflow.
The only requirement is that all the scans use the same experimental configuration as the parent and that the same sample space group can be used to orient all the scans. The unit cell parameters and orientation matrix are refined by a least-squares optimization of the Bragg peak locations identified in each new scan. If there is a significant change in the space group at a structural phase transition, it may be necessary to define different scan files as the parent for scans performed above or below the transition, respectively.
In this section, we will describe the structure of the NeXus files as well as details of how the NeXpy GUI dialogs in the Refine Menu can be used to prepare the files for subsequent analyis.
NeXus files
The scan files are stored using the hierarchical NeXus format, in which the data for each scan are stored in groups, or entries, conforming to the NXentry base class. There is one entry for each sample rotation scan, usually labelled f1, f2, f3, etc., although the number of such scans can vary. There is also a top-level entry (called ‘entry’), which contains the metadata that is common to all the rotation scans, as well as the results of merging the reduced data from each one.
In the example on the right, most of the items are also groups corresponding to different base classes, that contain either raw data, reduced data, metadata, or information resulting from each component of the workflow. When the NeXus file is loaded into NeXpy, its contents can be inspected in a tree view, such as the one shown here. Here are a few examples.
- instrument
This is a group that contains instrumental parameters, such as the incident wavelength, detector distance, goniometer angles, and attenuators. It also stores the powder calibration data and parameters.
- sample
This group contains the sample information, including the chemical formula, unit cell parameters, space and Laue groups, and sample environment parameters, such as temperature. NXRefine assumes that the sample parameters are independent of the particular rotation scan, so all the sample groups are linked to the one stored in the ‘entry’ group.
If the beam supports the import of monitor data from metadata files, there will be one or more groups, called monitor1, monitor2, etc, in the entries for each rotation scan. These contain the beamline monitor values for each frame, which can be used to normalize to changes in the incident flux during the rotation.
Note
The import of monitor data is governed by the NXBeamLine class, or its sub-class customized for a specific beamline.
There are a number of groups in the entries for each rotation scan that contain the results of some of the analysis.
- peaks
This group contains the results of all the Bragg peaks identified by the peak search, such as their pixel coordinates on the detector, their polar and azimuthal angles, and intensities. These are used to determine the sample orientation matrix, using the ‘Refine Lattice’ dialog.
- radial_sum
This group contains a sum of all the frames after azimuthal averaging using the powder calibration to define the beam center. The sum is stored in a NXdata group for plotting as a function of polar angle. This should be approximately equivalent to a powder average of the single crystal data.
- summed_data
This group contains a sum of all the frames in a NXdata group for plotting as a 2D image, with the pixel numbers as axes.
- summed_frames
This group contains a one-dimensional array produced by summing each frame. It is stored in a NXdata group for plotting against the frame number. In more recent versions of NXRefine, it also contains a partial sum produced by summing the frames between the specified Q-limits.


